A few weeks ago, I did some analysis with archived SportVU Player Tracking data (2015-16), looking at where on the court assists come from. You can read about that analysis at these links:
Blog post: https://analyzeball.com/2020/06/02/where-do-assists-come-from/,
Specific players: https://twitter.com/avyvar/status/1267189790388056064
League wide trends: https://twitter.com/avyvar/status/1270892658437705733).
Here, I’m a deeper dive on this data, looking at assists off misses and comparisons by position (Guards, Forwards, Center).
In addition, you might realize that the overall distribution of assists differs slightly from my previous tweets. This is because I used a more robust method of discovering assists from the raw SportVU logs. To find a general timeframe for when assists occurred, I have been using play-by-play data. But now, I determine the exact time of shot release time using calculus (smoothing, and then taking the derivative of the ball height with respect to the ground) and then backtracking to determine the last pass to this shot. This led to a significant increase in the number of assists in my dataset (around 2x more assists from before), leading to a change in the overall distribution.
Passes by shooter location
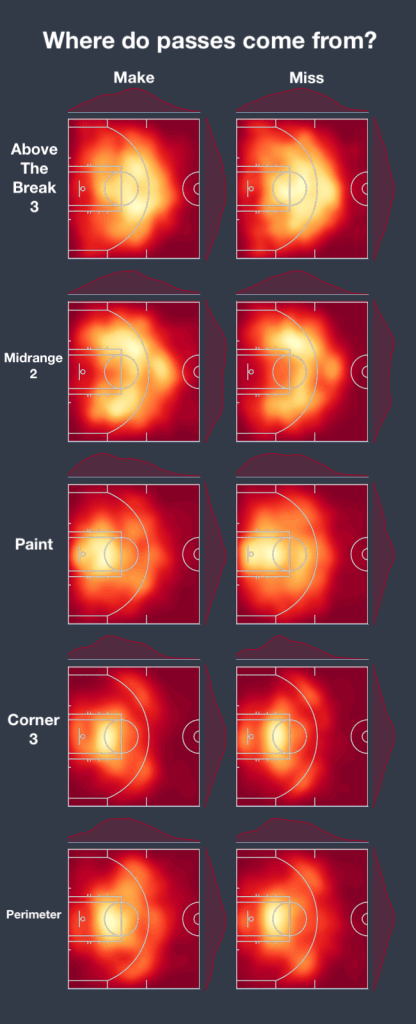
Here, we see a grid of shooter location and whether the shot was made or missed.
You can see that the distribution of assists for misses is quite similar to that of makes.
As we often see when we watch film, the corner-3, kick-out assist is widely popular in the league. Here’s an example.
This is an example of what makes the kick-out assist on the corner-3 so effective. Cody Martin drives in, attracting 3 defenders leaving PJ Washington wide open in the corner.
Splitting up by position
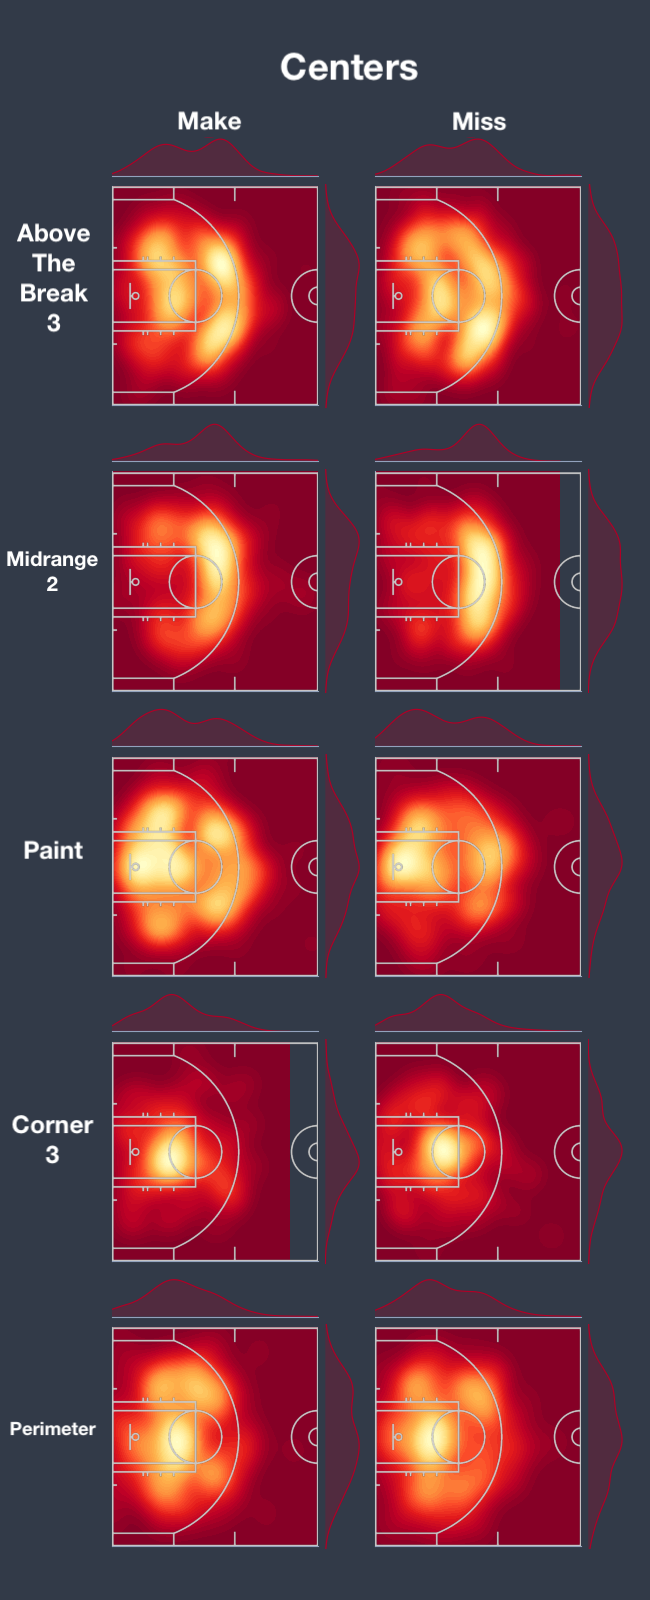
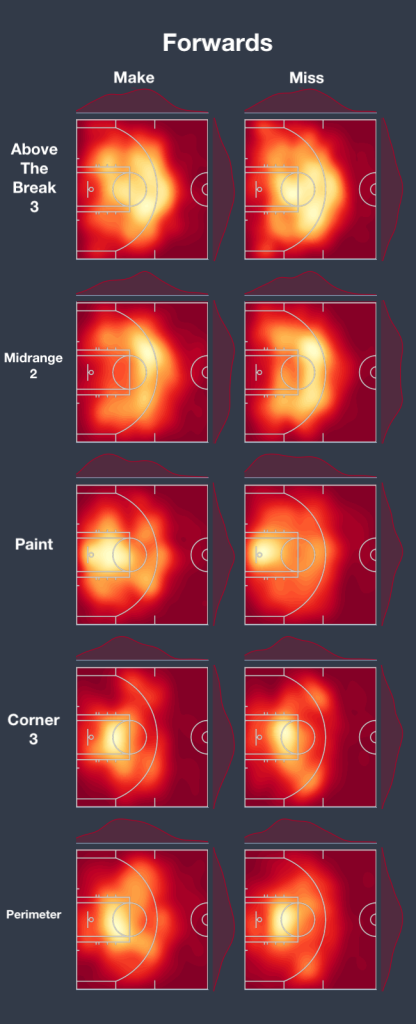

In general, from these graphs, it seems like Guards make assists farther from the hoop that Forwards and Centers, which is somewhat expected (based on offensive positioning bias).
However, I found it interesting that Guards pass more often from behind the 3 point line that Forwards.
This Jamal Murray assist clip is a good example of an action that guards perform more often than forwards (on above the break 3’s)
Here we see Jamal Murray getting double-teamed, Jokic setting a screen, eventually leading to Jamal Murray making a pass from behind the 3 point line. Will Barton fakes out Willie Cauley-Stein, eventually leading to an open look from 3.
Similarly, this clip highlights Forwards’ tendencies well.
And here we see a slightly different above the break 3 assist. PJ Washington makes a pass that resembles a kick-out corner-3 assist to Jalen McDaniels. Jalen McDaniels makes a cut toward the top of the key attracting two Miami defenders, leading to an open above-the-break 3 for Caleb Martin.
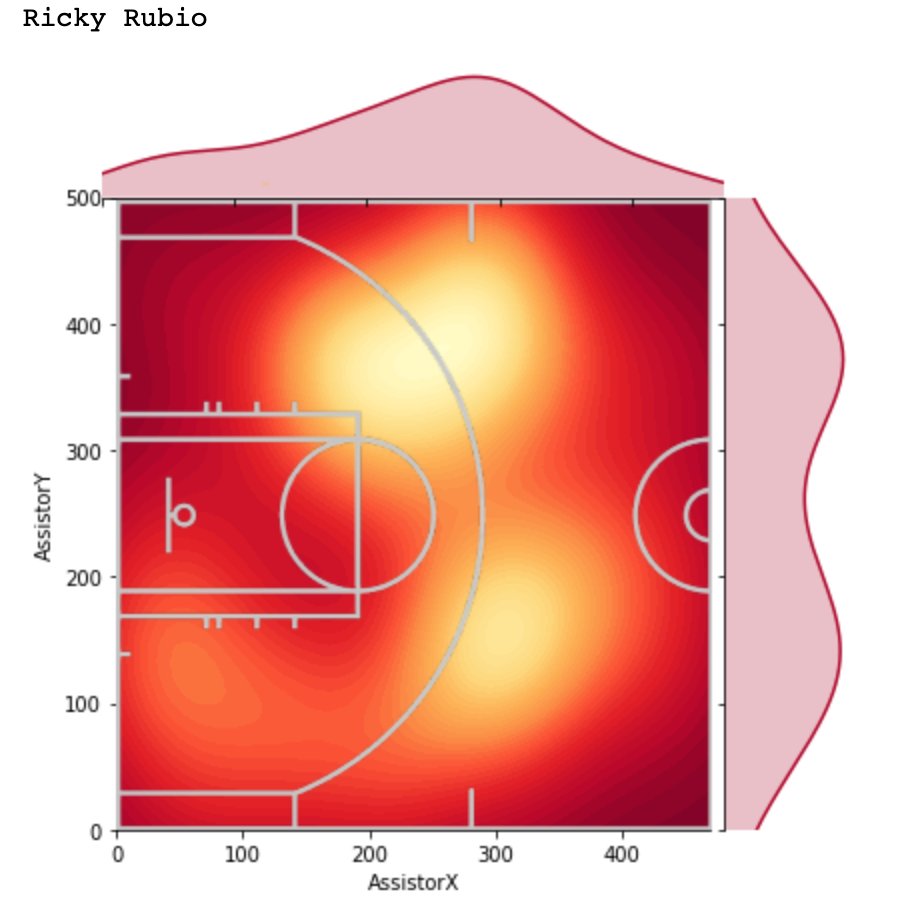
New Player Graphs
As I stated above, my new way of determining assists from the raw SportVU data is more robust. As a result, there is more data and gets us closer to the actual distribution from the season. The reason why I still am not confident in stating that these are the true distributions is because (a) Not all games from 2015-16 were in my dataset of raw logs and (b) I still am unable to extract all assists from the logs that I have. The players which I have placed below all have 80+ assists mapped for both made and missed shots. The original heat maps which I plotted were about 50-60+ assists per map. I will also be releasing my post-processed CSV file with all of the mapped assists at the end of this post.
But you can see that we need a lot of data to actually make real conclusions. The individual player graphs could be a little bit more helpful if I had more data, but for right now I’d mainly trust the league-wide and position specific graphs.
As we saw from my graphs from my original tweet, the overall distributions of some players seem to have changed a bit from before. These are definitely getting closer to the true distribution of where assists come from.
(Updated). Below each of the graphs, I have also added the distributions of assist from my tweet https://twitter.com/avyvar/status/1267189790388056064 for comparison purposes.
Ricky Rubio
Current Distribution (more data, more accurate)

Old Distribution (less data)
Stephen Curry
New Distribution (more data, more accurate)
Old Distribution (less data)

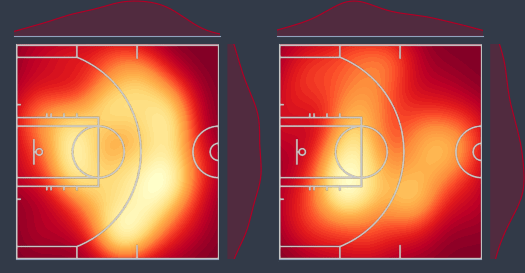
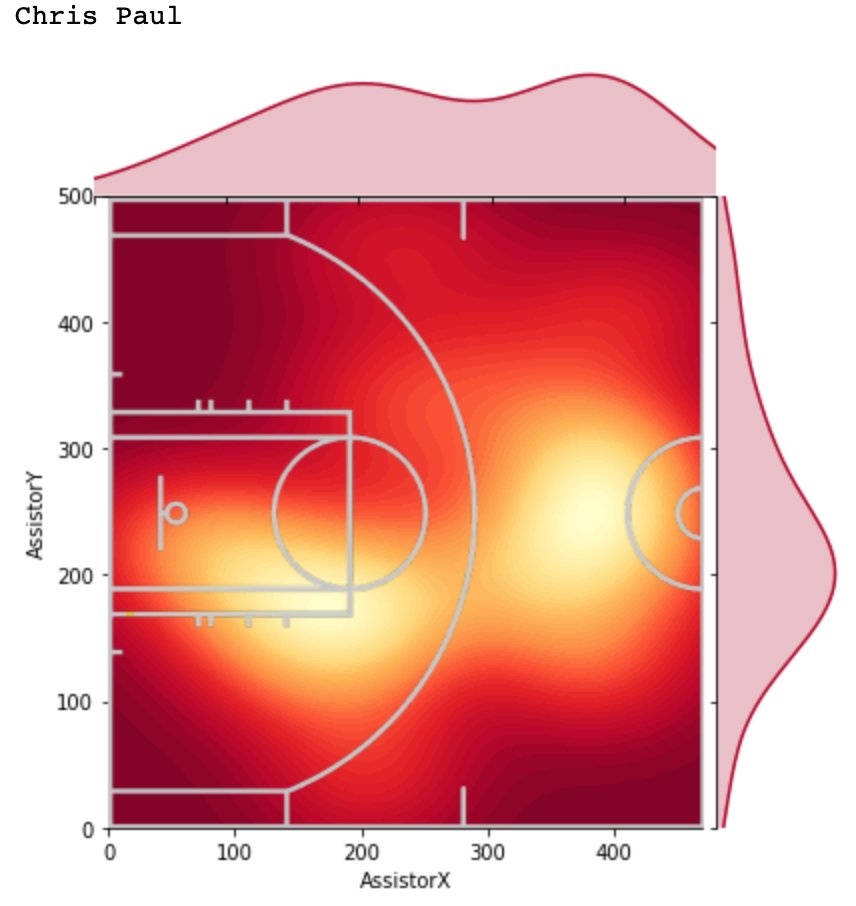
Chris Paul
New Distribution (more data, more accurate)

Old Distribution (less data)
LeBron James
New Distribution (more data, more accurate)

Old Distribution (less data)

Conclusion
For one, the distribution of assists on made shots vs. assists on missed shots are quite similar (league-wide). When we look at individual players, there seem to be differing distributions. But again, I would refrain from making any judgement about individual players based on this data.
In addition, there does seem to be variation between assist heat maps for different NBA positions.
One topic that interests me is defensive positioning on made/missed and assisted/not assisted shots by shot location (will be writing another post about this one soon, there are some interesting results).
If anyone has any suggestions my twitter is @avyvar and my email is avyayv@gmail.com.
Here is a repo containing the assists (in CSV format) https://github.com/avyayv/mappedassists. Let me know if you’d like me to clarify anything.
Acknowledgments
Thanks to Dean Oliver (@DeanO_Lytics), Todd Whitehead (@CrumpledJumper), and Patrick McFarlane (@py_ball_) for their feedback on this project. A lot of this post was based on their suggestions.
I found the videos for each of the plays using 3ball.io.
